Dashboarding
Create a dashboard with your data
You want to measure and monitor your KPIs, observe trends in real time and / or extract and synthesize the key elements of a mass of data (Quantitative and Qualitative), the Sphinx team supports you in setting up reporting platforms online.
Thanks to the technical and methodological expertise of our teams and the strength of our analysis and Data Visualization tools, we support you in the creation of online Dashboards.
We advise you to establish your dashboards for monitoring indicators in real time to communicate with pedagogy and interactively with your employees and partners. With alerts, you can act quickly and fairly with instant information and process data on the fly to spot weak signals early on.
With your data from different sources (Excel files, online customer reviews, databases, APIs, etc.), we advise you to:

Develop the most adequate and tailor-made decision dashboard with real-time monitoring of indicators (customer / employee / patient satisfaction, quality of services, etc.) combining the power of quantitative and qualitative analyzes with the flexibility of data visualization to extract and synthesize the key elements of a mass of data.
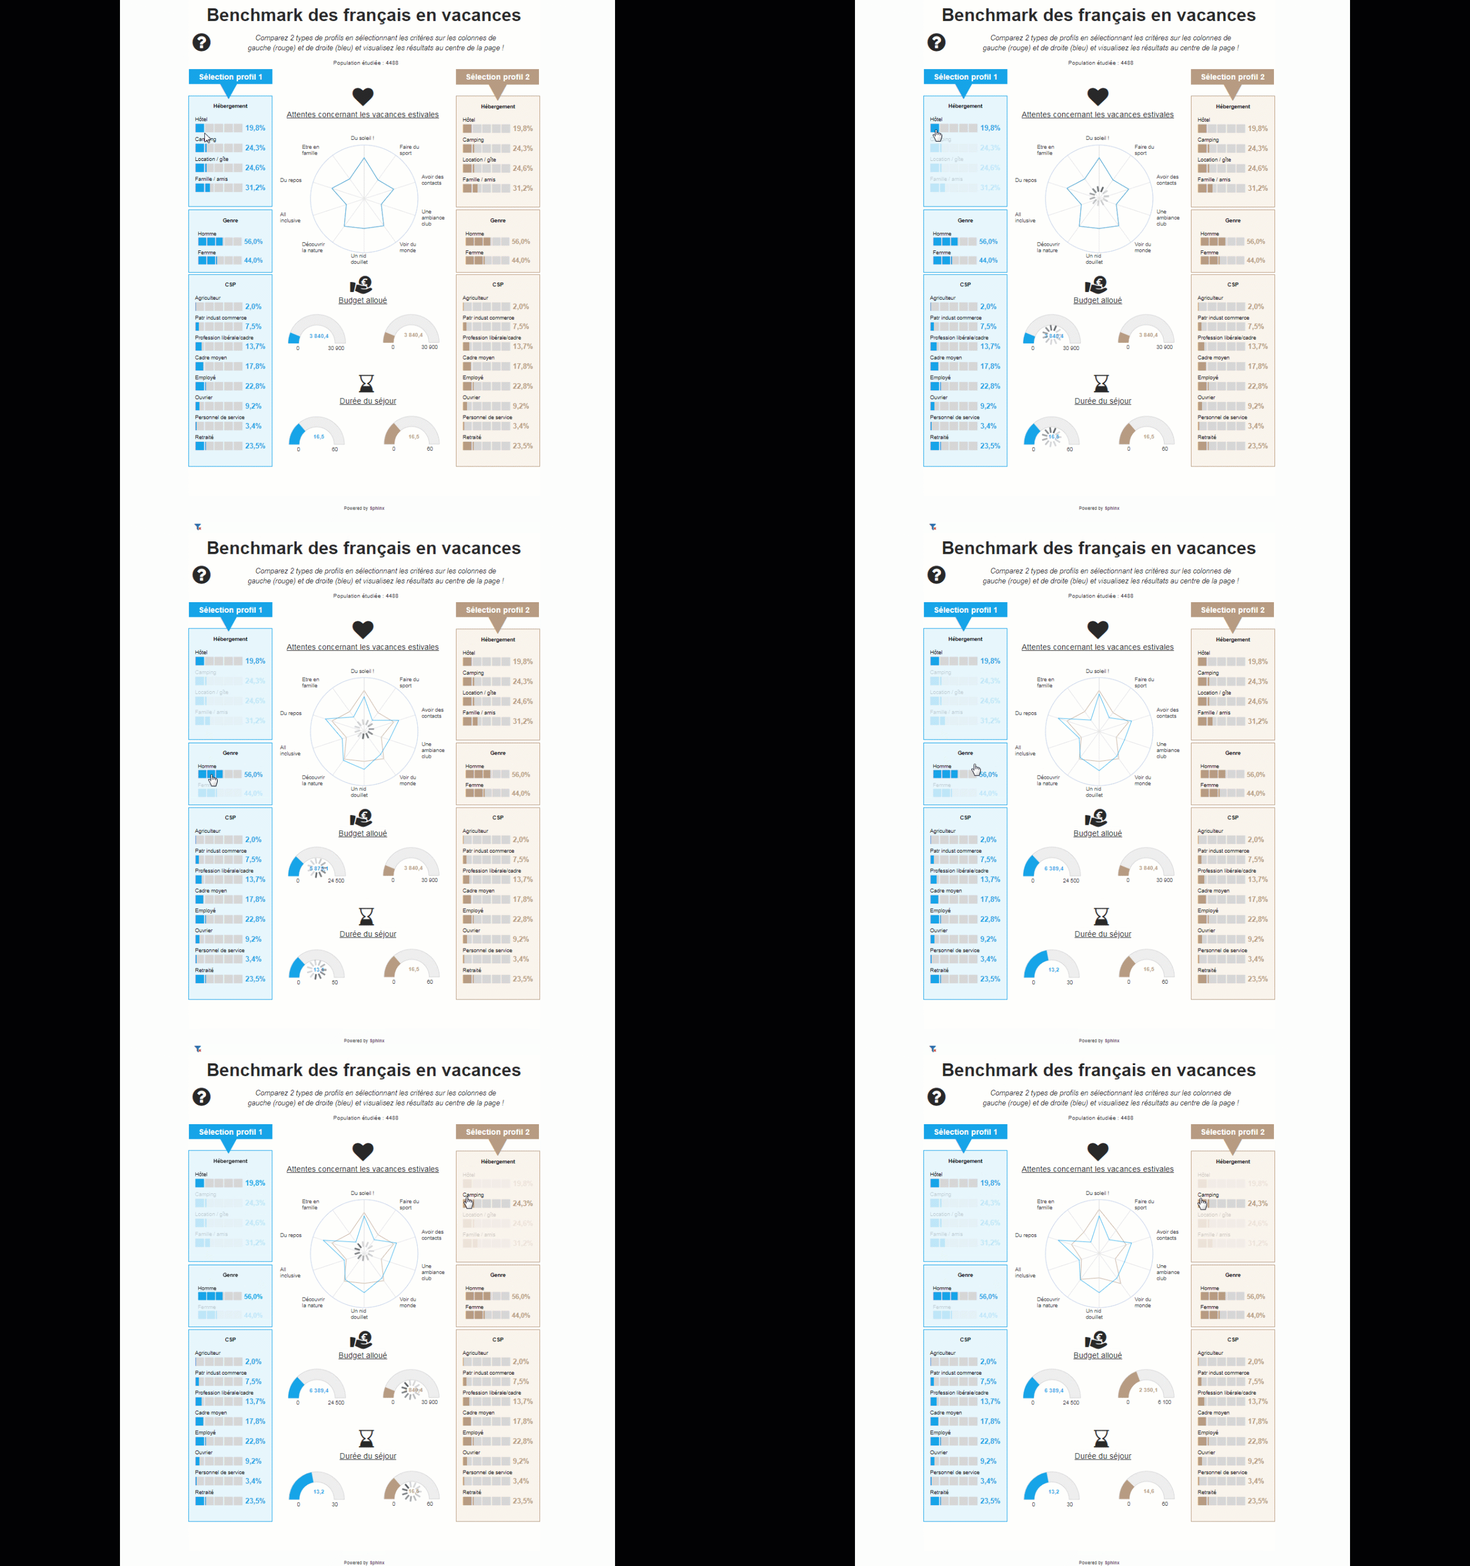
Make your data speak with comparisons of profiles, three-dimensional analyzes, geographical maps, interactive word clouds, strengths / weaknesses tables, benchmark and classification analyzes ... making your reporting visual and communicative to facilitate your decision-making.


Share lively and impactful reports with the storytelling of your indicators, updated in real time, allowing readers to explore the data while engaging them with interactive and scripted information.
The Sphinx team puts all its expertise at your disposal for the segmentation of contacts and indicators, the scripting of information, the design and graphics of your reports and infographics, the interconnection of your tools via APIs and secure and targeted sharing. of your Dashboard.
Find out more about our analysis, data visualization and data sharing solution: DATAVIV'